The Net Promoter Score (NPS) has become a staple metric for gauging customer loyalty in many organizations. It’s an uncomplicated process where customers rate their likelihood of recommending your product or service on a scale of 0 to 10.
However, NPS often falls short in capturing the true nuances of customer behavior. Adding alternatives to NPS can provide a much deeper understanding of customer loyalty and satisfaction, enabling you to craft data-driven strategies that enhance your overall customer experience (CX).
We recommend looking into NPS alternatives, designed to bridge these analytical gaps and drive customer satisfaction to new heights.
Net Promoter Score (NPS) and its limitations
In 2003, Fred Reichheld, a partner at Bain & Company, revolutionized the way we evaluate customer loyalty towards a company with a simple yet effective metric, the Net Promoter Score (NPS).
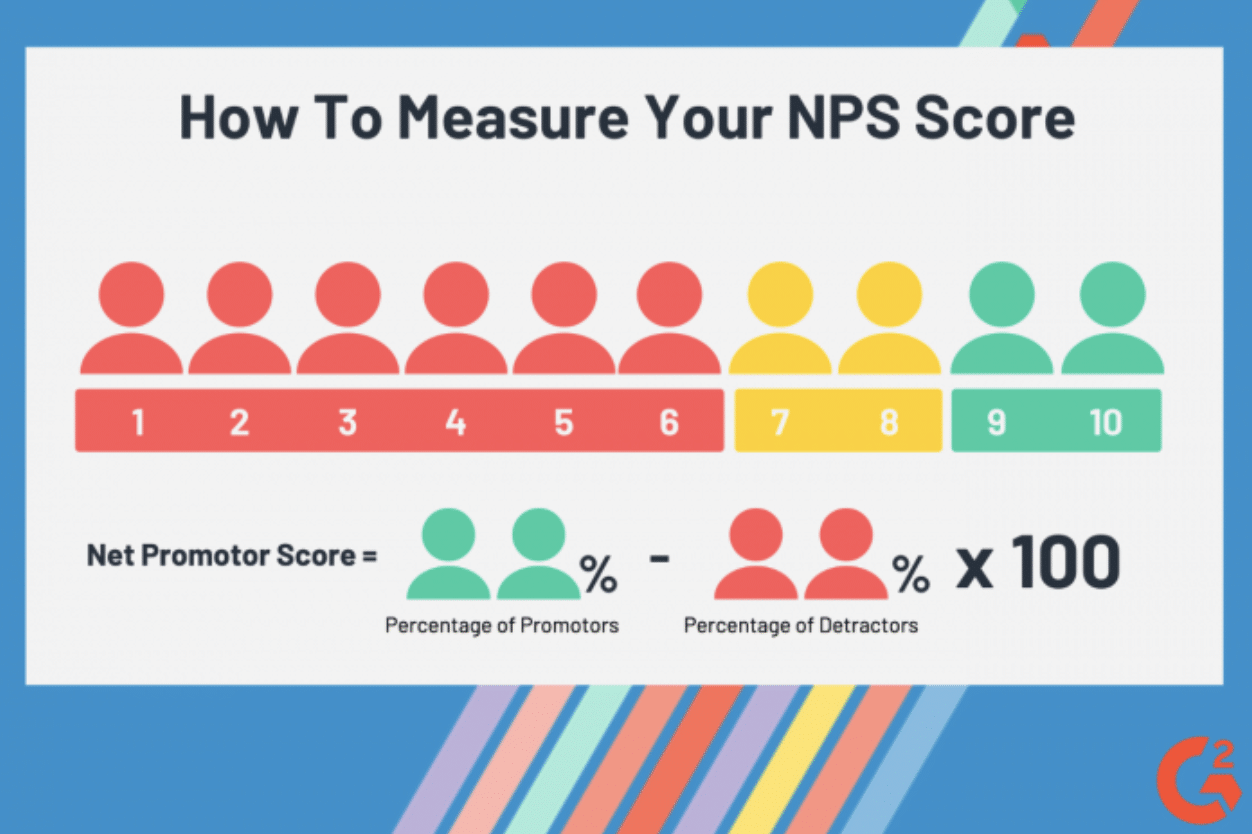
The NPS score is calculated from a straightforward customer survey, consisting of a single simple question – “How likely are you to recommend our business?” Responses are collected from individual customers on a point scale of 0 to 10, and then combined to generate an overall business NPS score from -100 to +100. The higher the score, the more satisfied and loyal your customers are presumed to be.
NPS, though useful, should not be seen as the definitive yardstick for success. The NPS methodology has several inherent limitations:
- It measures how likely people are to recommend you, but doesn’t track who actually recommends you.
- It often overlooks the impact of passive customers and detractors.
- It doesn’t account for the fluctuating moods and experiences of customers.
- It fails to consider competitive dynamics.
- It focuses on external perceptions rather than inward reflection
NPS alternatives, on the other hand, offer a more holistic approach, compensating for these shortcomings to provide a multi-faceted view of customer loyalty.
Top 9 NPS alternatives
Have the shortcomings of NPS surveys have left you searching for a more comprehensive solution? There are plenty of alternatives. These benchmarks are designed to increase accuracy and provide more predictiveness in evaluating satisfaction levels, customer loyalty, and growth throughout the customer journey.
The NPS alternatives we cover below overcome the limitations of the net promoter score, and provide a more nuanced understanding of your customer base. Use them with NPS, or instead of NPS, for more actionable insights and a more detailed view of customer satisfaction.
1. Customer Effort Score (CES survey)
In a world where time is precious, the simpler, the better. A staggering 96% of clients who have a high-effort service interaction are more likely to become disloyal. In contrast, customers who experience a low-effort interaction are far more likely to remain loyal.
The Customer Effort Score (CES survey) is designed to measure the effort customers exert when engaging with your business. Survey questions that measure CES could involve evaluating the ease of using your product, or how efficiently your service reps resolved an issue.
So, how does CES differ from NPS?
While NPS paints a broader picture of your relationship with customers, CES goes a step further. It registers individual customer experiences and satisfaction – not just one snapshot of a customer’s overall satisfaction level – to anticipate loyalty trends.
The importance of KPIs such as CES in delivering value to your clients cannot be overstated. By reducing customer effort, you generate positive word-of-mouth and increase repurchase rates.
2. Customer Satisfaction Score (CSAT score)
Satisfied customers are the cornerstone of a sustainable business. They validate your market position, inspire confidence in stakeholders, and are a driving force for long-term prosperity.
Research suggests that high customer satisfaction scores correlate with increased lifetime value, enhanced customer retention, and a fortified brand image. On the flip side, low scores are equally significant, revealing customer pain points and providing valuable insightsfrom respondents.
These insights can inform data-driven strategies to elevate the user experience to the next level. This is where the Customer Satisfaction Score (CSAT score) comes in.
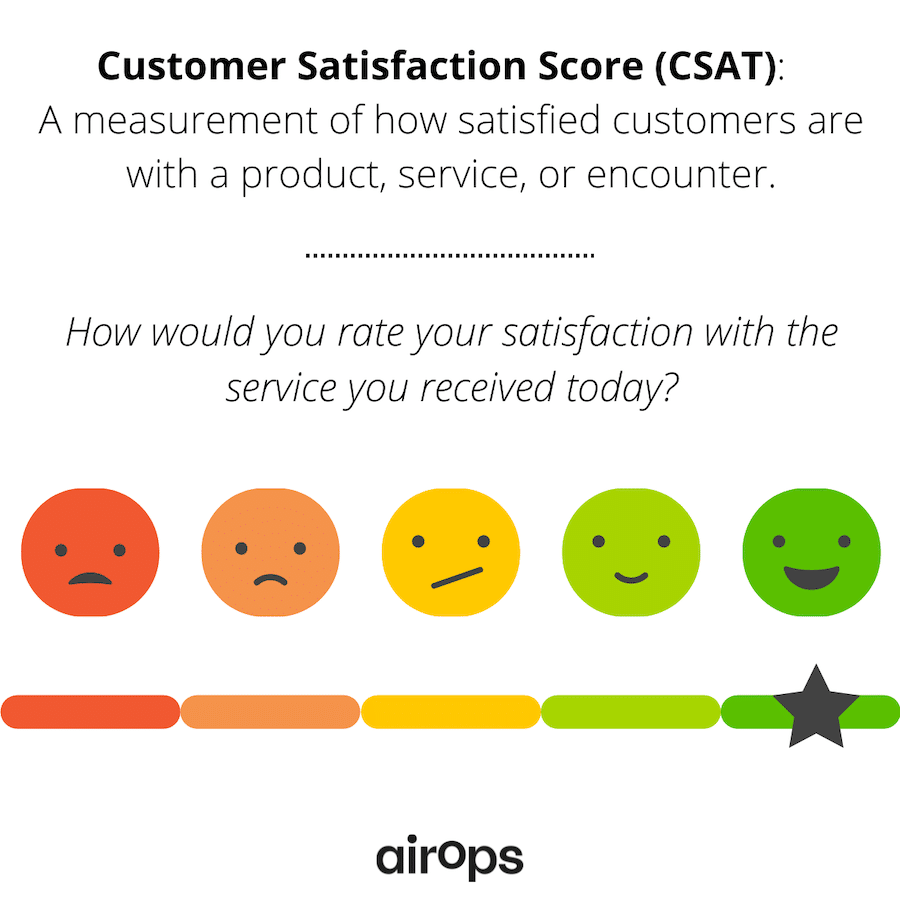
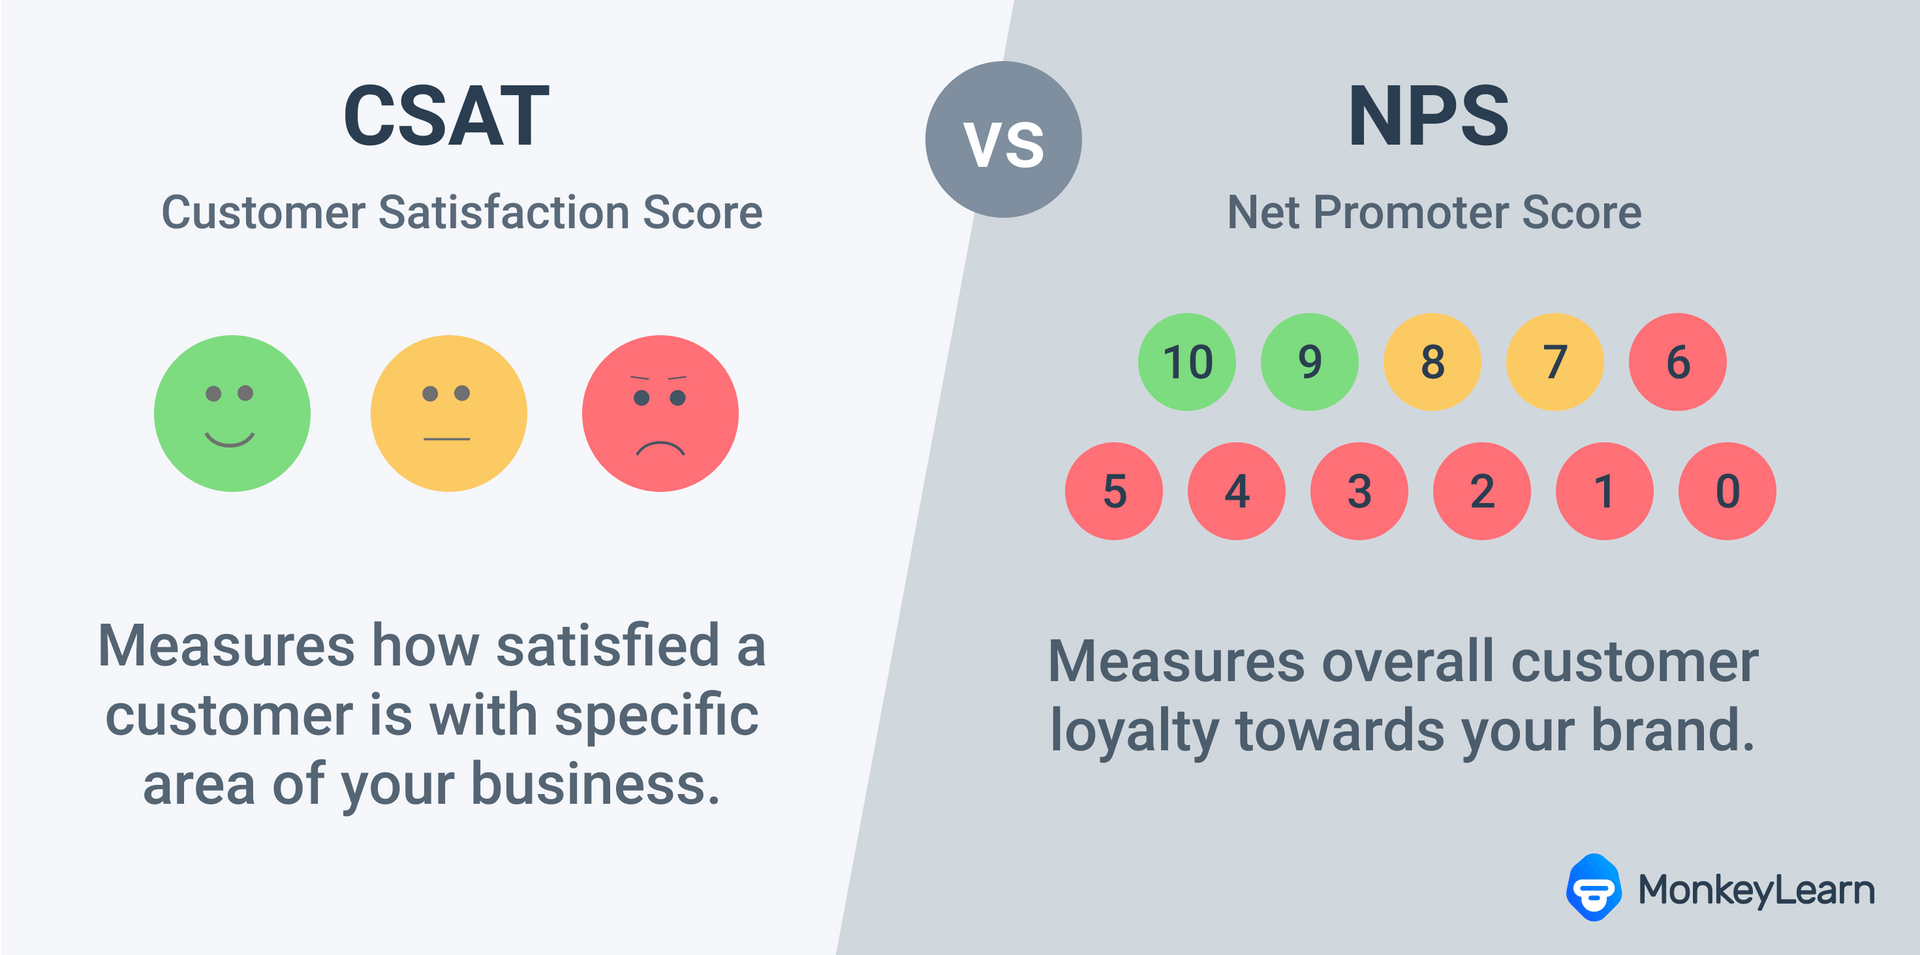
CSAT is the primary metric for measuring how satisfied your target audience is with the product/service you offer, as well as how pleased they are with your customer service. While it shares some commonalities with NPS, it differs in its approach to evaluating customer satisfaction. CSAT surveys allow businesses to gauge customer satisfaction levels on specific interactions or experiences, while NPS measures overall satisfaction with your company.
NPS focuses on assessing the likelihood of customers recommending a product or service, emphasizing long-term relationship analysis based on customer feedback. CSAT, conversely, measures customer satisfaction levels and can serve as both a short-term and long-term metric.
3. Customer emotion score
Consistently meeting your commitments as a business builds trust. When customers trust you, they’re more likely to return and make repeat purchases. Surveys indicate that a positive customer experience can increase trust in an organization by 4.2 times and make customers 3.5 times more likely to make additional purchases.
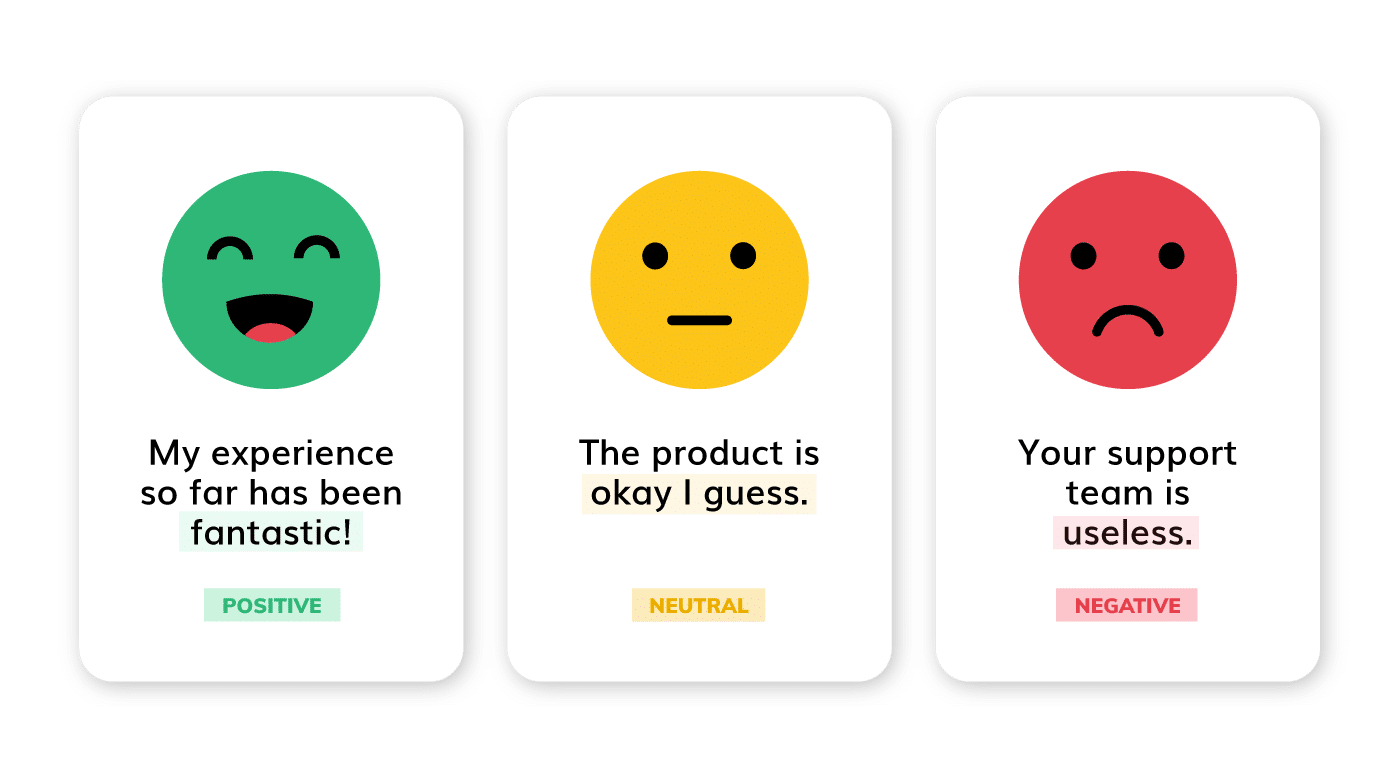
The customer emotion score (sometimes called the sentiment score) is a measure of a customer’s overall satisfaction with their interactions with a specific company or brand. Unlike NPS, which gauges brand loyalty and client experience, the emotion score dives deeper, offering a representation of the emotional value of clients.
Usually, to find out the customer emotion score, you’ll check the percentage of positive emotional words customers use to describe your brand versus the percentage of negative words they use to describe your brand. Or, you might use an algorithm in a customer service software (or brand mention tool) that assigns values to “emotional” words and generates a score.
Customer touchpoints can span various interactions, from browsing a website to making a purchase, contacting customer support, or receiving after-sales service. Each touchpoint is an opportunity to influence and shape the customer’s emotional response, ultimately impacting their perception of your company or brand. Customer emotion score can complement NPS to provide a more holistic view of customer sentiment.
4. Customer retention rate vs. churn rate
Keeping your customers is as critical as acquiring new ones. According to Frederick Reichheld, businesses lose about 10% to 25% of their customers each year on average, with the typical customer retention rate across various industries standing at approximately 75.5%.
Measuring customer retention rate and churn rate can serve as an alternative to NPS by focusing on how many customers stay vs. leave. Staying relevant in the face of fierce competition and ever-evolving market trends requires an understanding of customer churn and retention patterns. By monitoring these metrics, you can gain profound insight into the dynamics of customer loyalty.
Employing this metric enables the creation of strategies that can mitigate churn, whether that involves pricing adjustments or enhancements to your service. Over time, reducing the number of detractors can significantly boost your success rate.
5. Customer lifetime value (CLV)
Customer lifetime value (CLV) is an essential metric to track within a comprehensive customer experience program.
CLV goes beyond individual transactions to measure the average value a customer brings to your company over the entirety of their relationship with your brand. It includes multiple purchases and interactions, recognizing the long-term value and potential revenue derived from sustained customer loyalty and engagement.
Two perspectives are important when considering customer lifetime value: historic customer lifetime value and predictive customer lifetime value. The former evaluates the cumulative spending of existing customers with your company, while the latter predicts potential future spending.
Both methodologies are essential for tracking business performance and success, offering a more comprehensive view than a single-question NPS survey.
6. Product engagement score
Product engagement score, or PES, is a metric that investigates how users interact with your product to see how satisfied they are and how likely they are to keep using it. Generally, it’s uses by SaaS (software) companies.
Product engagement score measures:
- Adoption, or the average number of key events users complete within the software (that show “aha moments”)
- Stickiness, or the average percentage of weekly users who return daily, or monthly users who return weekly
- Growth, or new, reactivated, and upgraded accounts divided by the number of churned accounts
Add these three numbers together and divide by 3, and you have the product engagement score.
Even if you aren’t a SaaS business, you still might want to measure stickiness, as that gives you an idea of how likely you are to retain a customer. Outside of the SaaS sphere, you can measure stickiness as the likelihood someone will continue to purchase from you, because they see you as better than competitors.
7. Customer health score
In the race to stay ahead of the competition, a myriad of measurements can help you understand customer sentiments better.
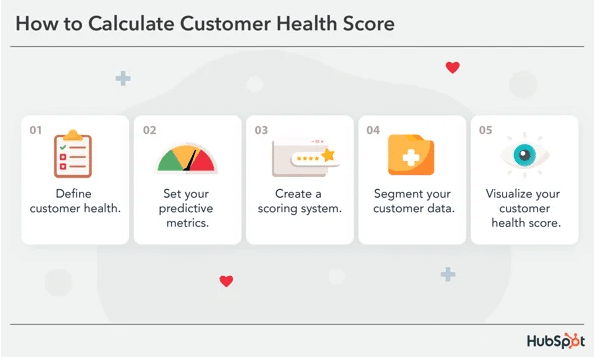
The customer health score is a pivotal metric used to assess whether a customer intends to stick with or leave your business. It considers various factors like engagement, usage patterns, and customer feedback. This metric is especially valuable for customer service teams and account managers, as it helps identify customers at risk of churn and assess the level of that risk.
Tracking customer health scores enables progress monitoring of your customer success program, facilitating well-informed decisions about necessary adjustments.
Leveraging insights derived from your customer health score can yield three primary benefits for your company:
- Decreased churn: Happy customers are less likely to churn, leading to improved customer retention rates.
- Increased sales: Satisfied customers are more likely to purchase additional products or services, leading to an increase in sales.
- Improved reputation: Happy customers are more likely to promote your business to others, leading to an improved brand reputation.
The customer health score focuses on actionable metrics, resulting in proactive strategies that preempt customer dissatisfaction and promote customer satisfaction and retention.
8. Earned growth rate
Earned growth rate measures the amount of money a company generates via customer referrals. It’s actually meant as an expansion and improvement of NPS, as they share the same creator. Rather than predicting possible referrals, it actively measures the impact of people who have referred you.
You’ll calculate earned growth rate by finding the revenue generated this year from customers who were also with you last year, and then adding that to the percentage of revenue generated from newly referred customers.
9. Referral rate
Referral marketing is an impactful growth strategy that capitalizes on the inherent trust that customers have in recommendations from their friends and family. When compared to advertisements, 83% of customers trust recommendations from friends and family more.
By measuring the referral rate, or the percentage of total purchases made that come from referrals, you can gauge the effectiveness of your customer referral programs. This can provide a clear indication of customer loyalty and the perceived value of your offerings. Referral rate is a great alternative metric to NPS for measuring customer satisfaction and loyalty, as it shows that customers have already referred you to others rather than just predicting likelihood of referrals.
Businesses with high referral rates have many satisfied customers who are willing to recommend their products or services to others – and have actively and effectively done that recommending, leading to many new customers.
A low referral rate, on the other hand, might indicate that customers are not satisfied enough to refer your business to others. This can be a crucial metric for gauging the success of your business and implementing changes to improve customer satisfaction.
Measure and improve your referral rate in real-time with dedicated referral software.
Wrap-up
While the standard NPS question provides a helpful snapshot of customer loyalty, it doesn’t delve into the specifics that could unlock a deeper understanding of customer behavior.
That’s where NPS alternatives step in. By tapping into these alternative metrics, businesses can go beyond the traditional NPS scale, monitor the behavior of both current and potential customers, and leverage data-driven insights to improve customer satisfaction.
Ready to rethink NPS? By embracing these NPS alternatives, you can elevate your business performance, drive growth, and foster a sustainable and loyal customer base.
Remember, the key to successful customer loyalty is not limited to one score or metric. It’s about understanding your customers’ experiences across multiple dimensions, and with several different measurements. A holistic approach to customer loyalty will guide your business towards sustainable growth. Choose and act on multiple metrics based on your specific needs, and watch your growth take off!

